There are several options to generate optimizations output. You can:
Generate a two-page optimization HTML report with a custom time range and export the HTML output to your Google Drive to share with your team.
Generate an optimization results summary to customize your own reports, visualizations, or export them to another format. These numerical summaries of your media metrics let you access more detail.
You can also plot optimization visualizations. For more information, see Plot optimization visualizations.
Generate the optimization HTML report
Run the following code to generate the optimization HTML:
If you use colab and want to export the report to your Google Drive, mount Google Drive to your colab notebook:
from google.colab import drive
drive.mount('/content/drive')
Instantiate the
BudgetOptimizerclass and run theoptimize()method. You can also customize the optimization as described in the preceding sections.budget_optimizer = optimizer.BudgetOptimizer(meridian) optimization_results = budget_optimizer.optimize()Pass in the filename and path to
output_model_results_summaryto run the summary for optimization and save it to the specified file.Example:
filepath = '/content/drive/MyDrive'
optimization_results.output_optimization_summary(f'{FILENAME}.html', filepath)
Where:
filepathis the path in your Google Drive where you want to save your file.FILENAMEis the name you want to specify for the file, for exampleoptimization_output.html. The file extension must be HTML.
The HTML report is generated and saved to the specified file location.
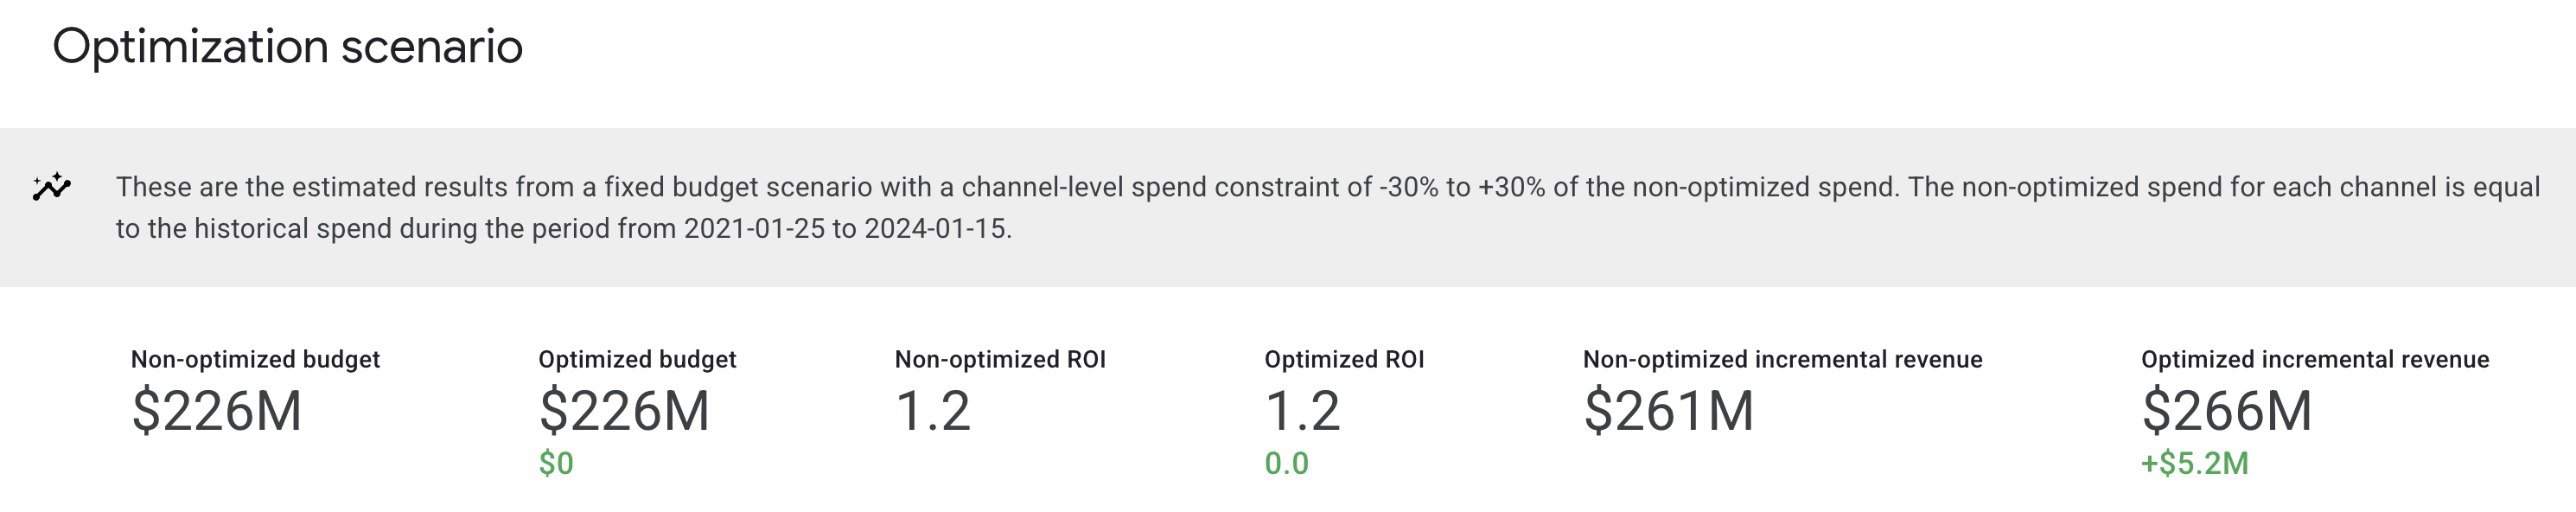
Optimization scenario plan
The Optimization scenario plan section shows your optimized budget, ROI and incremental revenue or KPI. Additionally, this section presents the constraints imposed on spending at the channel level and the benchmark time period for budget optimization.
Example output: (Click the image to enlarge.)
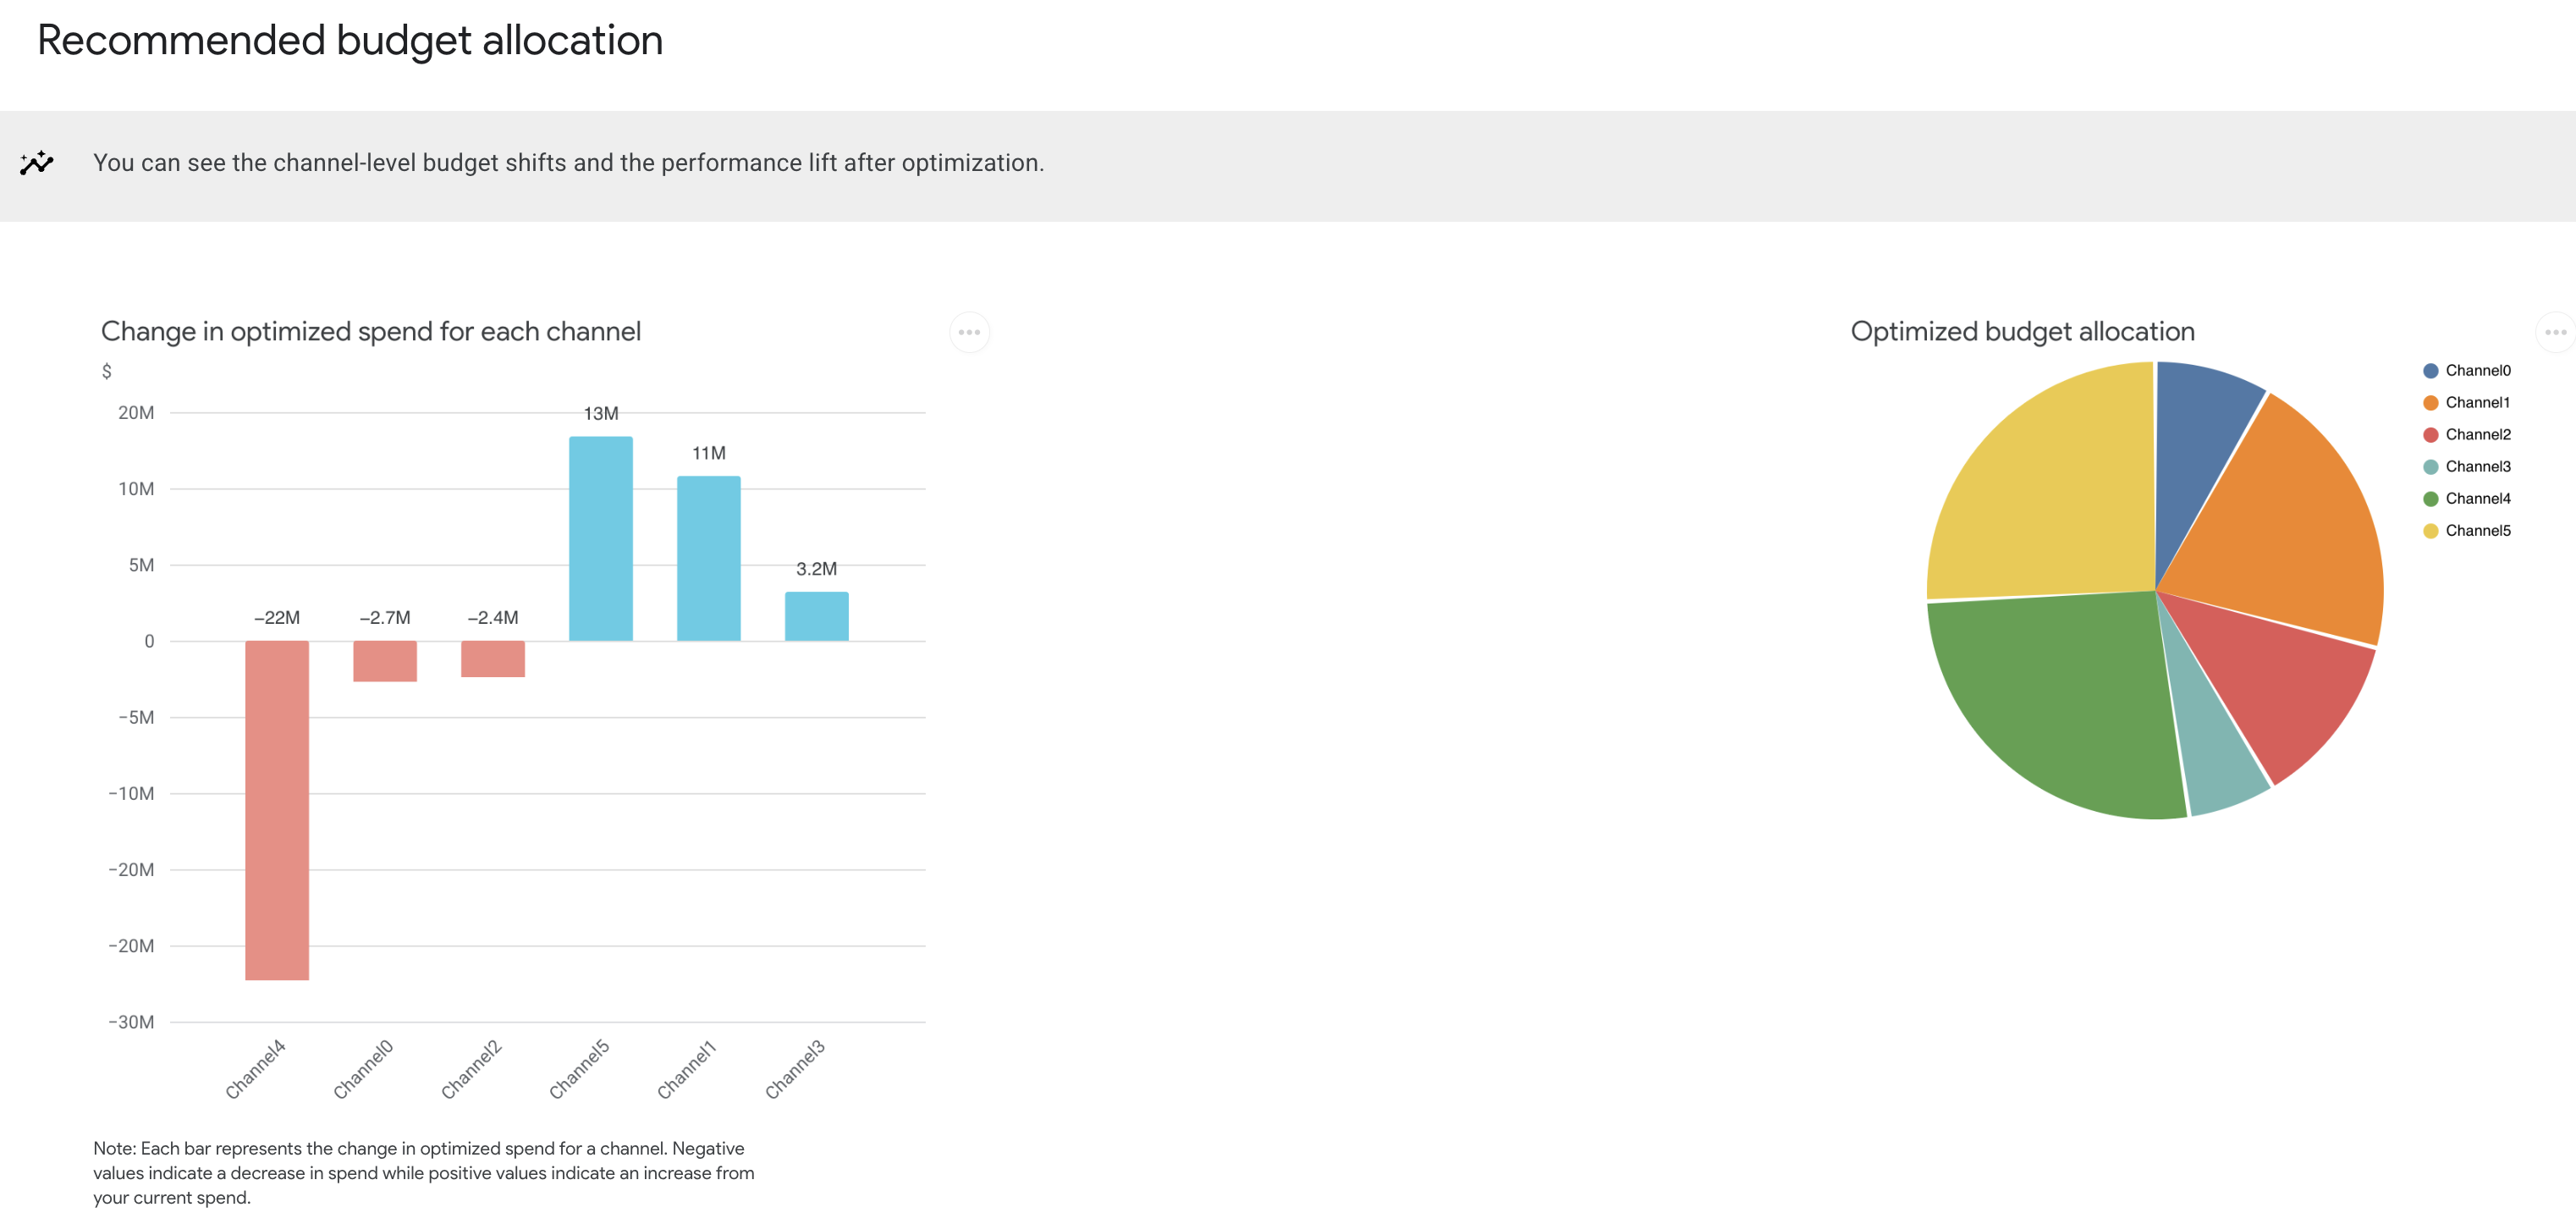
Recommended budget allocation
The Recommended budget allocation charts show the change in optimized spend for each channel. This section also shows the disparity in incremental revenue or KPI for each channel from current to optimized spending.
Example output: (Click the image to enlarge.)
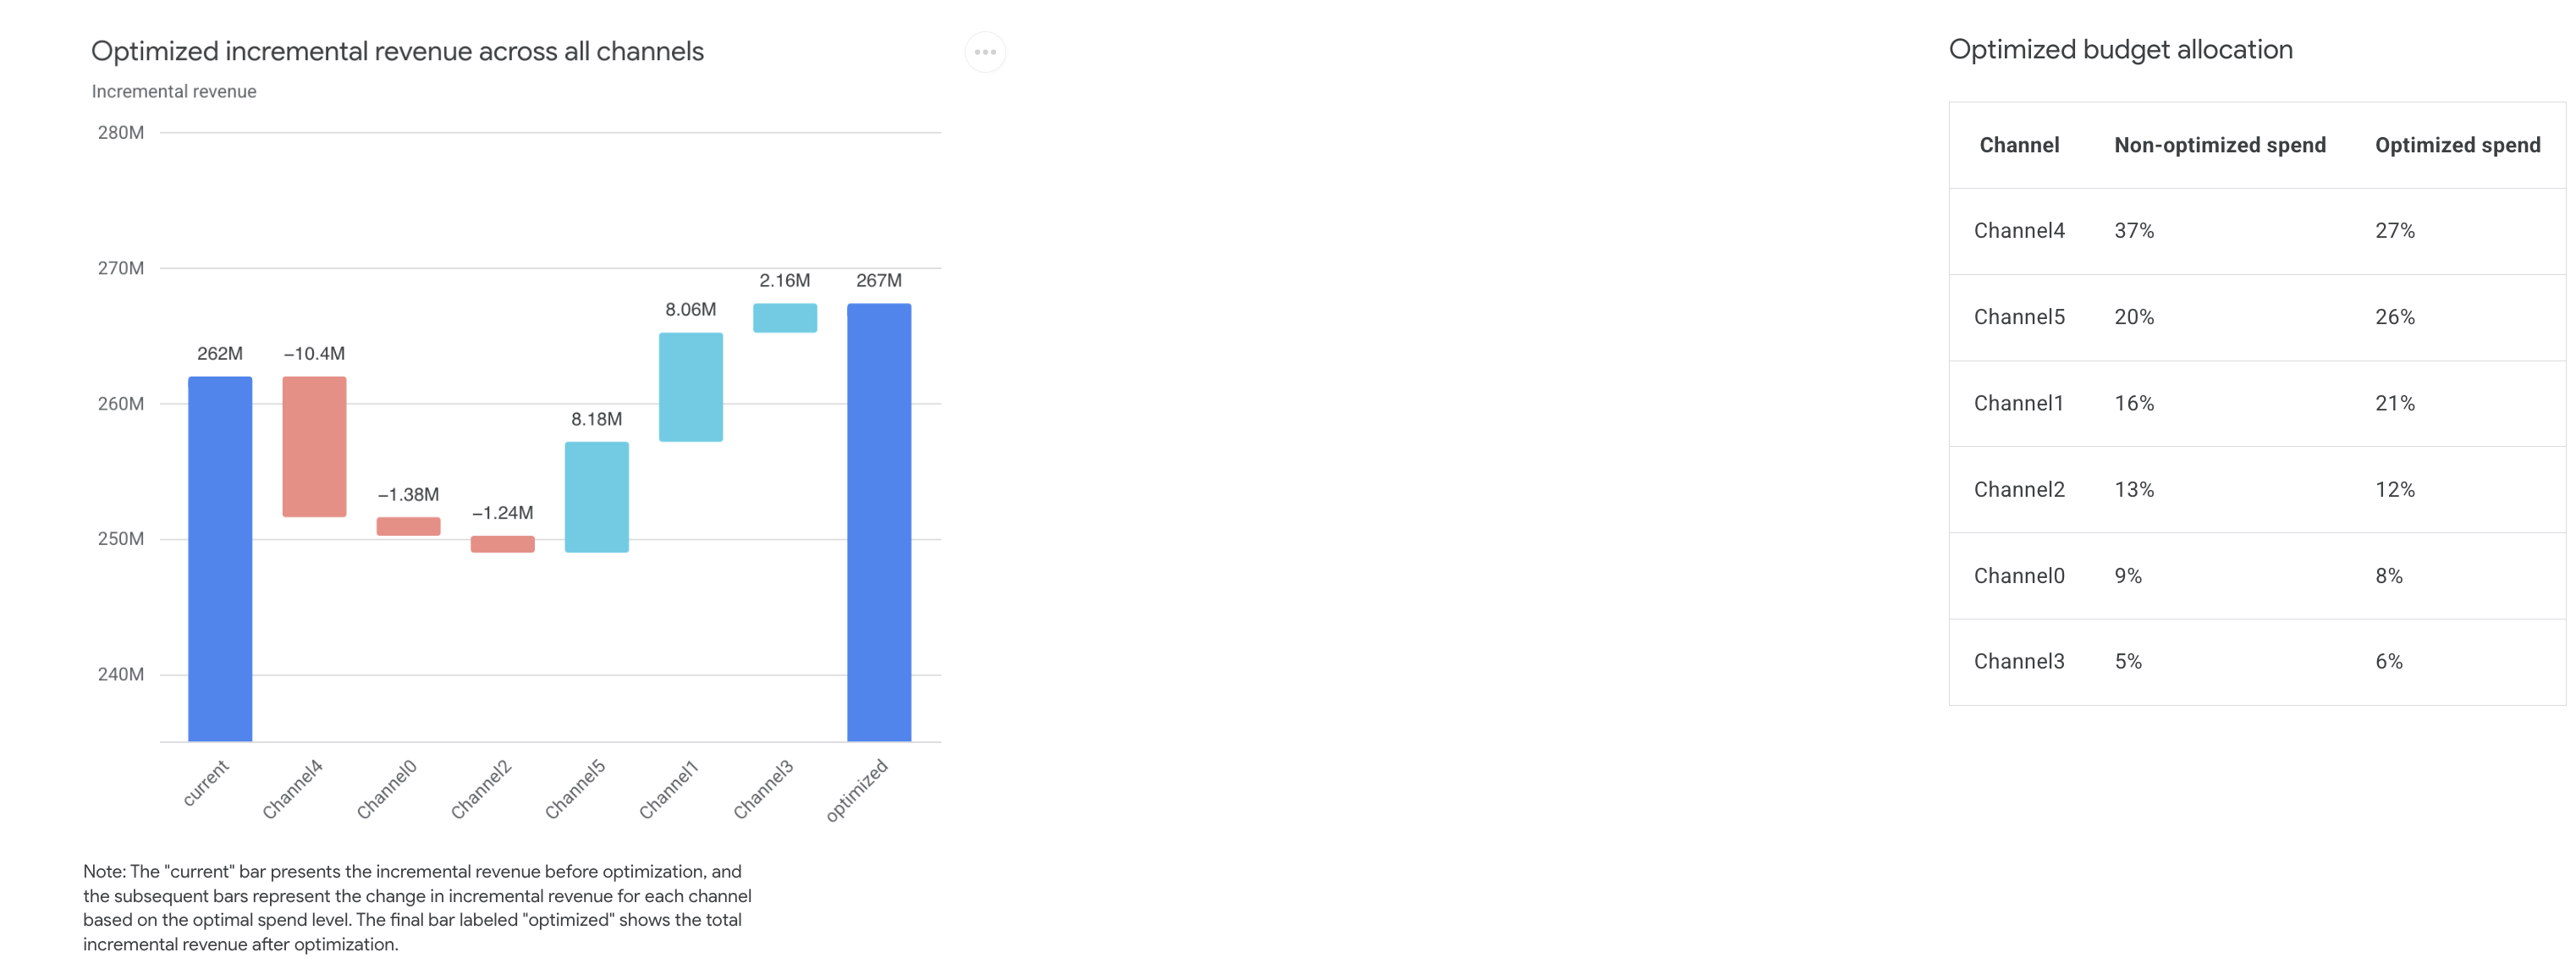
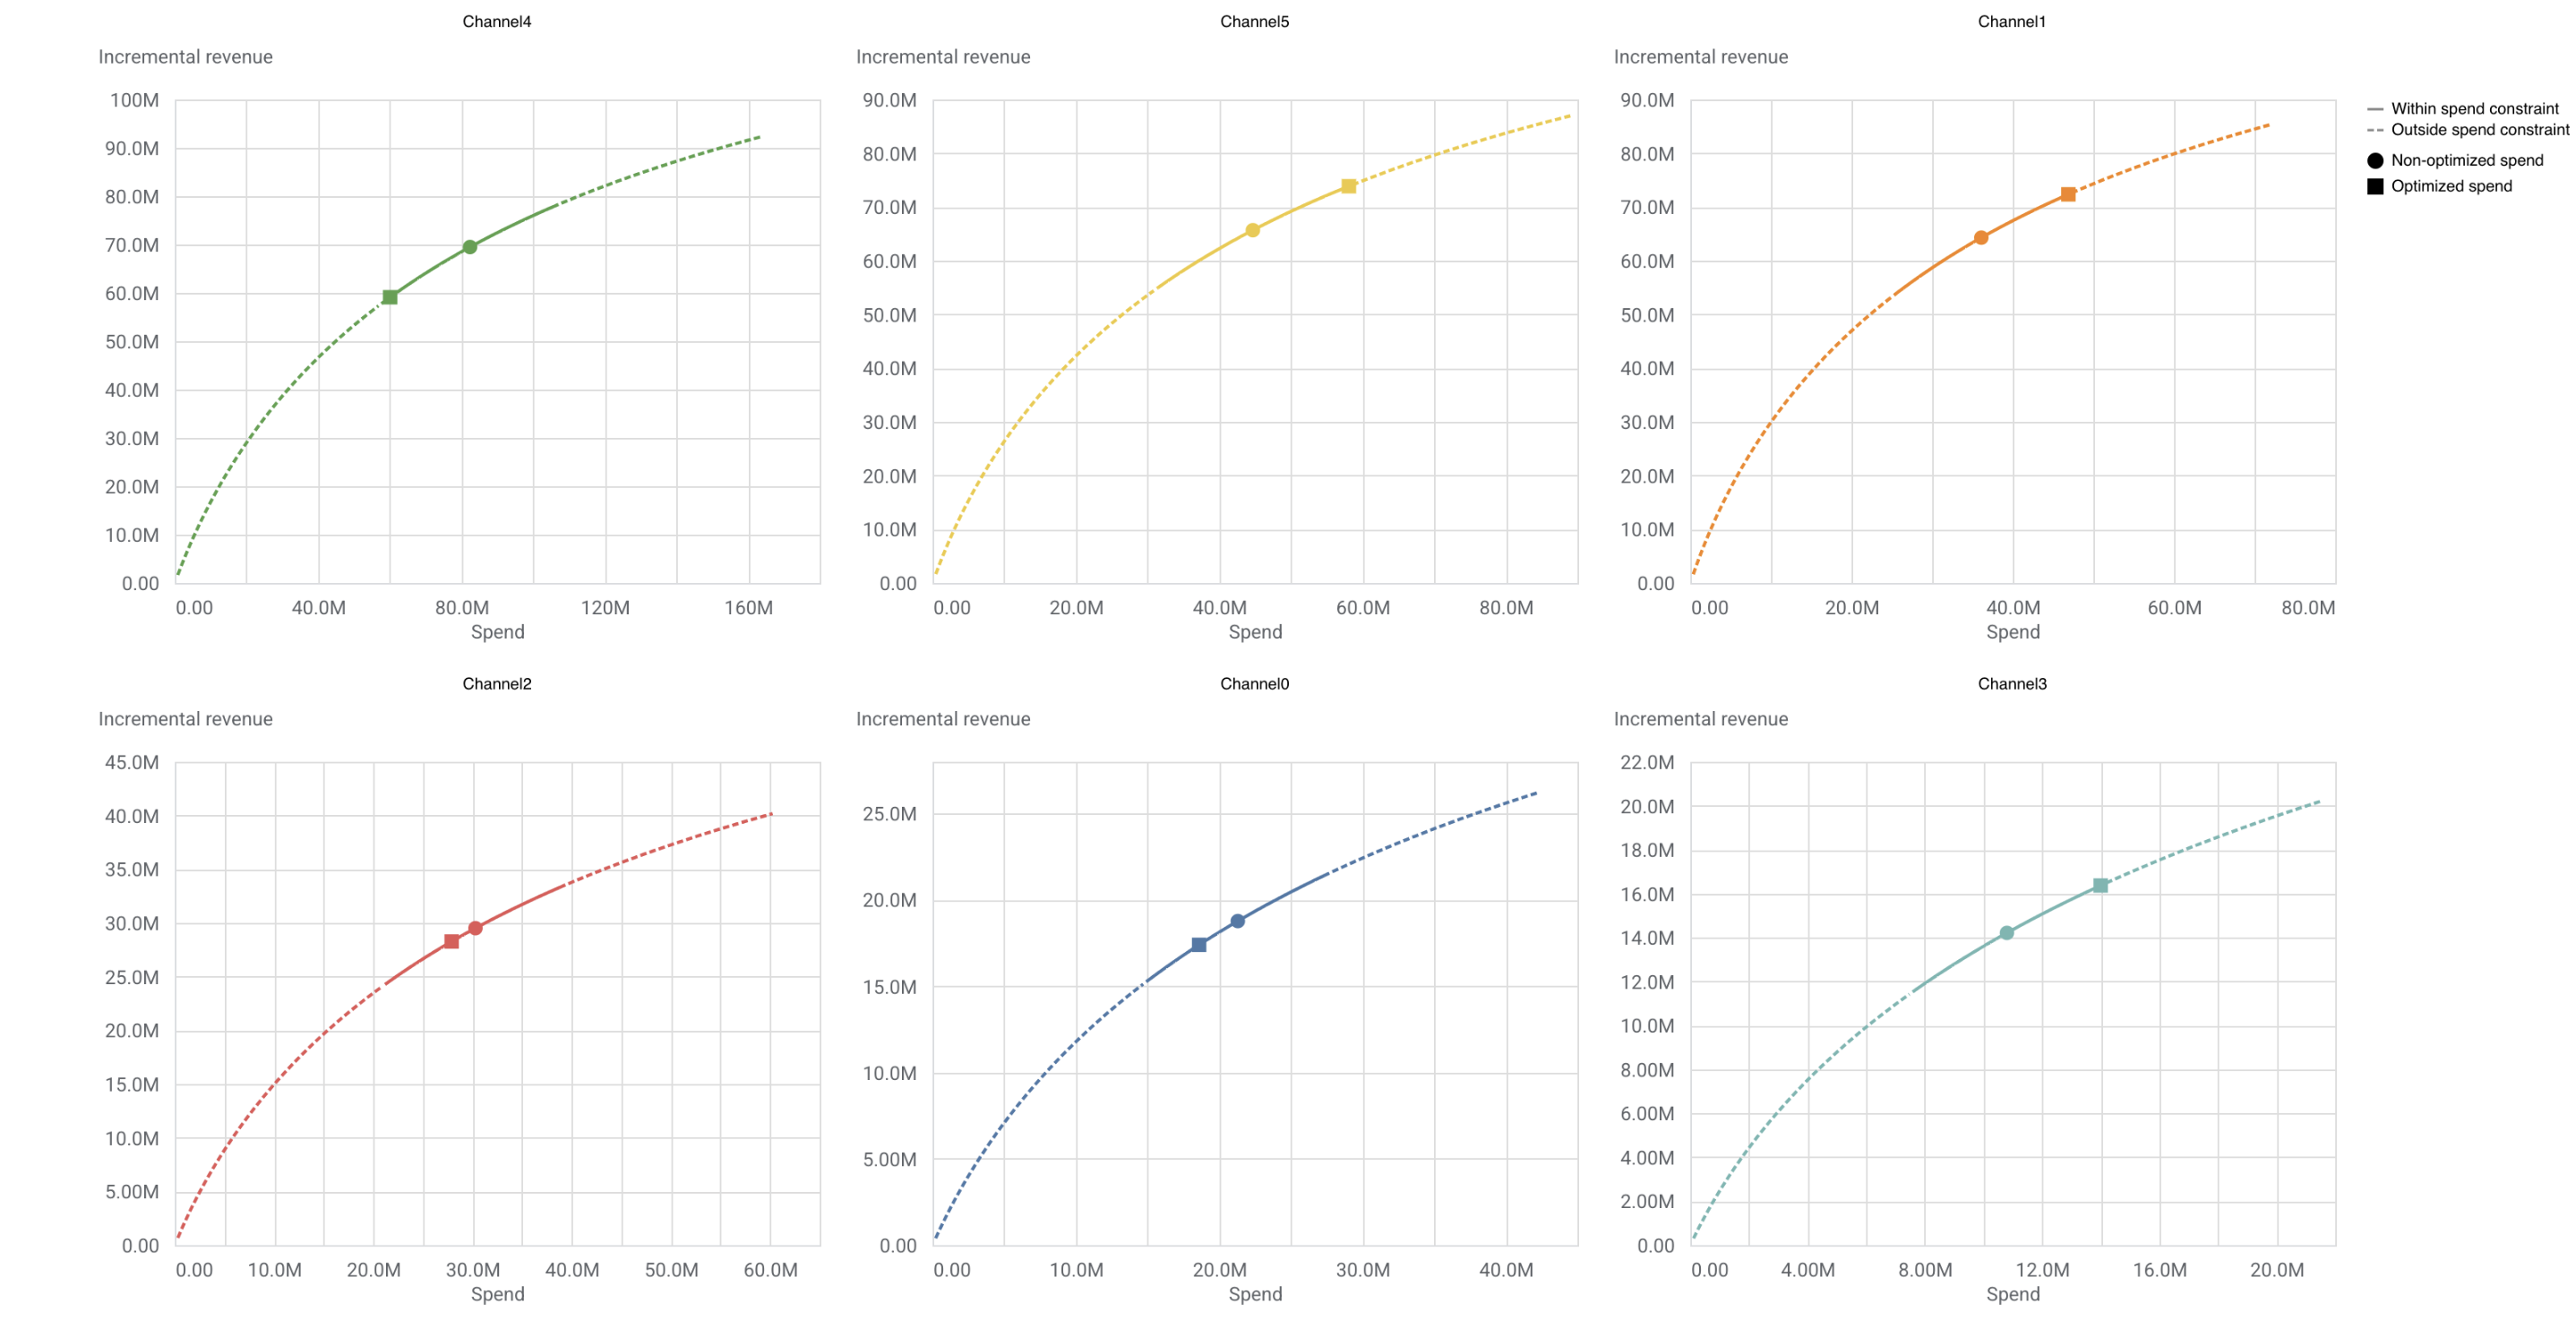
Optimized response curves by channel
The Optimized response curves by channel section displays your current and optimized levels of channel-level spending on the response curves.
Example output: (Click the image to enlarge.)
Generate the optimization results summary
You can generate non-optimized and optimized data summaries to customize your own reports, visualizations, or export them to another format. These numeric summaries go into more detail, breaking down the results by channel so that you can compare the optimized and non-optimized results.
These data summaries are available inside the OptimizationResults dataclass
container that is returned by optimize() method.
Non-optimized summary
Run the following command to generate the non-optimized data summary:
optimization_results.nonoptimized_data
Example output:
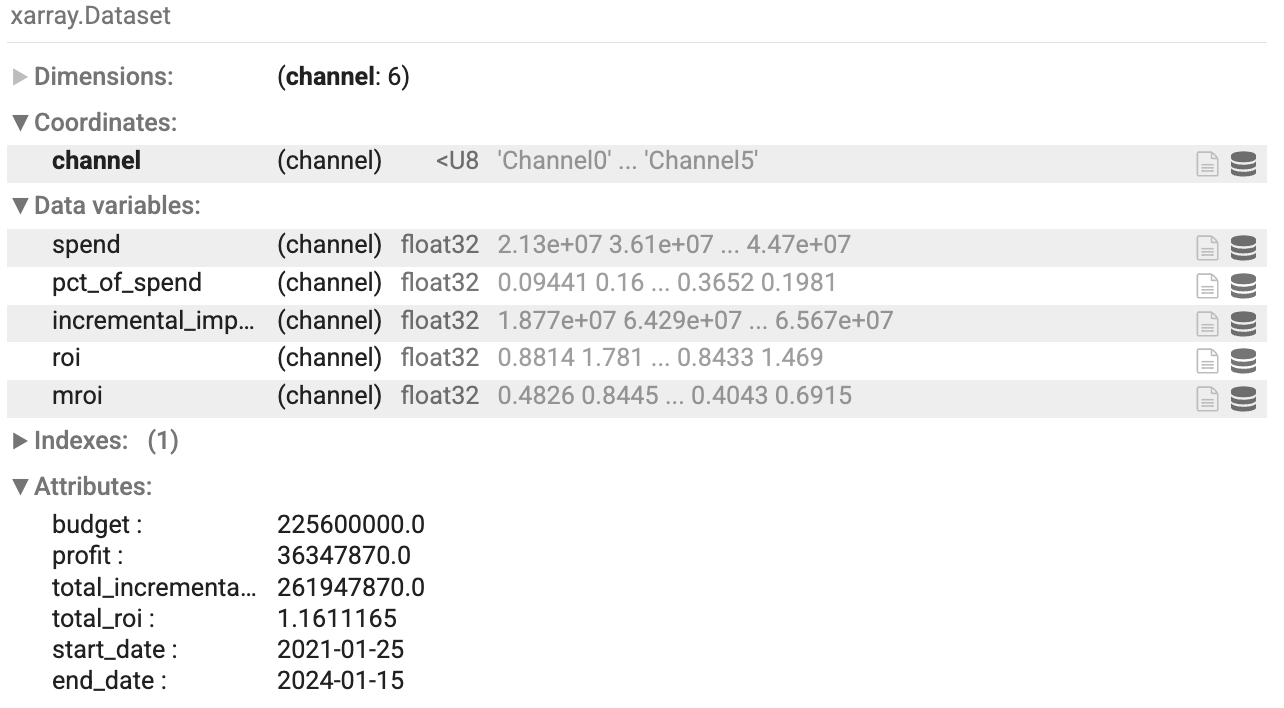
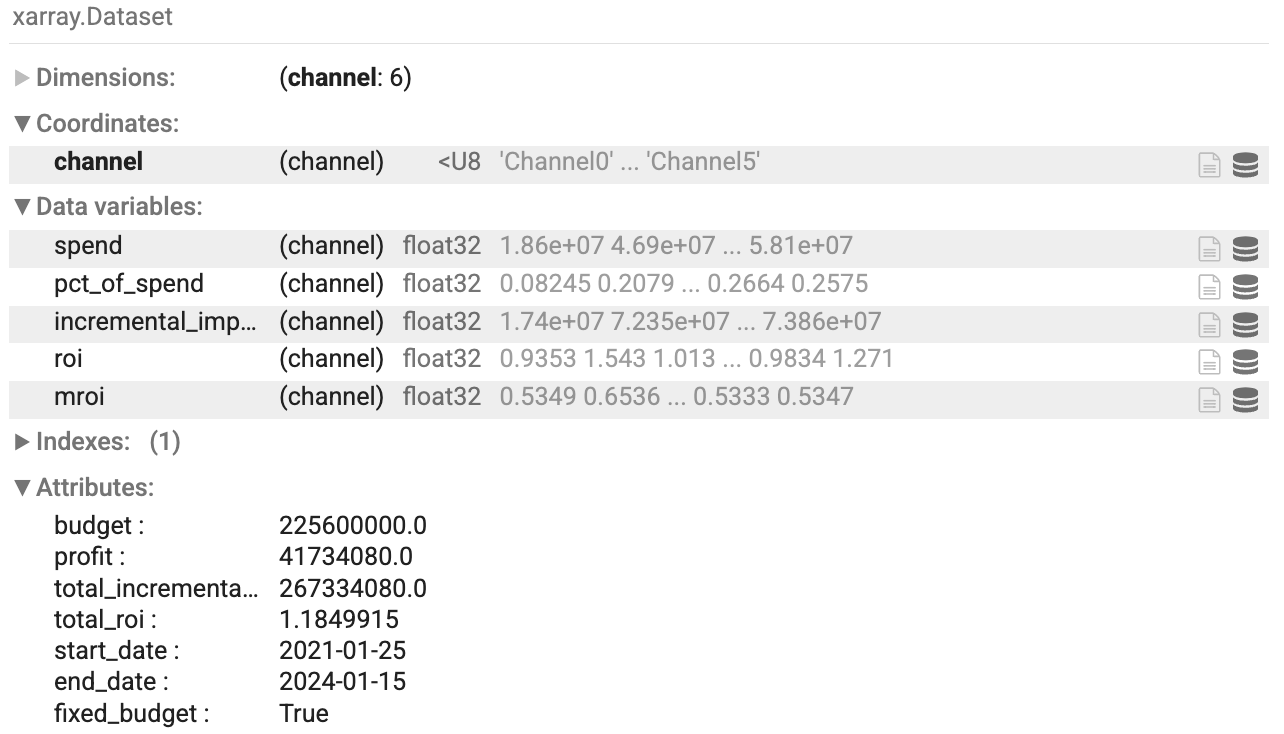
Optimized summary
Run the following command to generate the optimized data summary:
optimization_results.optimized_data
Example output: