There are several options to generate model results output. You can:
Generate a two-page HTML report with a custom time range and export the HTML output to your Google Drive to share with your team.
Generate a model results summary to customize your own reports, visualizations, or export them to another format. These numerical summaries of your media metrics let you access more detail.
You can also plot media visualizations. For more information, see Plot media visualizations.
Generate the model results HTML report
To generate and export the model results report:
If you use Colab and want to export the report to your Google Drive, mount Google Drive to your Colab notebook:
from google.colab import drive
drive.mount('/content/drive')
Initialize the
Summarizerclass with the Meridian model object:summarizer = summarizer.Summarizer(meridian)Pass in the filename, path, start date, and end date to
output_model_results_summaryto run the summary for that time duration and save it to the specified file.Example:
filepath = '/content/drive/MyDrive'
start_date = '2020-01-05'
end_date = '2020-12-27'
summarizer.output_model_results_summary(f'{FILENAME}.html',
                                        filepath,
                                        start_date,
                                        end_date)
Where:
filepathis the path in your Google Drive where you want to save your file.start_dateis the report's start date using the yyyy-mm-dd format.end_dateis the report's end date using the yyyy-mm-dd format.FILENAMEis the name you want to specify for the file, for examplesummary_output.html. The file extension must be HTML.
The HTML report is generated and saved to the specified file location.
Your model's fit
The Your model's fit section lets you check statistical goodness of fit. Meridian reports model fit statistics including R-squared, Mean Absolute Percentage Error (MAPE) and Weighted Mean Absolute Percentage Error (wMAPE). Additionally, Meridian provides visual representations comparing predicted revenue (or KPI) to actual revenue (or KPI) figures. These plots facilitate the assessment of the model's performance and assist in determining whether the model is underfitted.
Model fit statistics can also be useful for comparing candidate models. However, keep in mind that goodness of fit metrics don't give a complete picture of how good a model is for causal inference, and it might likely be the case that the best model for causal inference is different from the best model for prediction.
For information about assessing the model fit, see Modeling diagnostics.
Example output: (Click the image to enlarge.)

Revenue or KPI contribution
The Revenue or KPI Contribution section provides an analysis of the impact of your media and non-media activities on your revenue or KPI performance. It lets you compare key metrics such as return on investment (ROI), percent of spend, and percent of incremental revenue or KPI across different channels. Additionally, this section lets you break down the contribution by baseline, pricing promotions, and various marketing channels.
Example output: (Click the image to enlarge.)

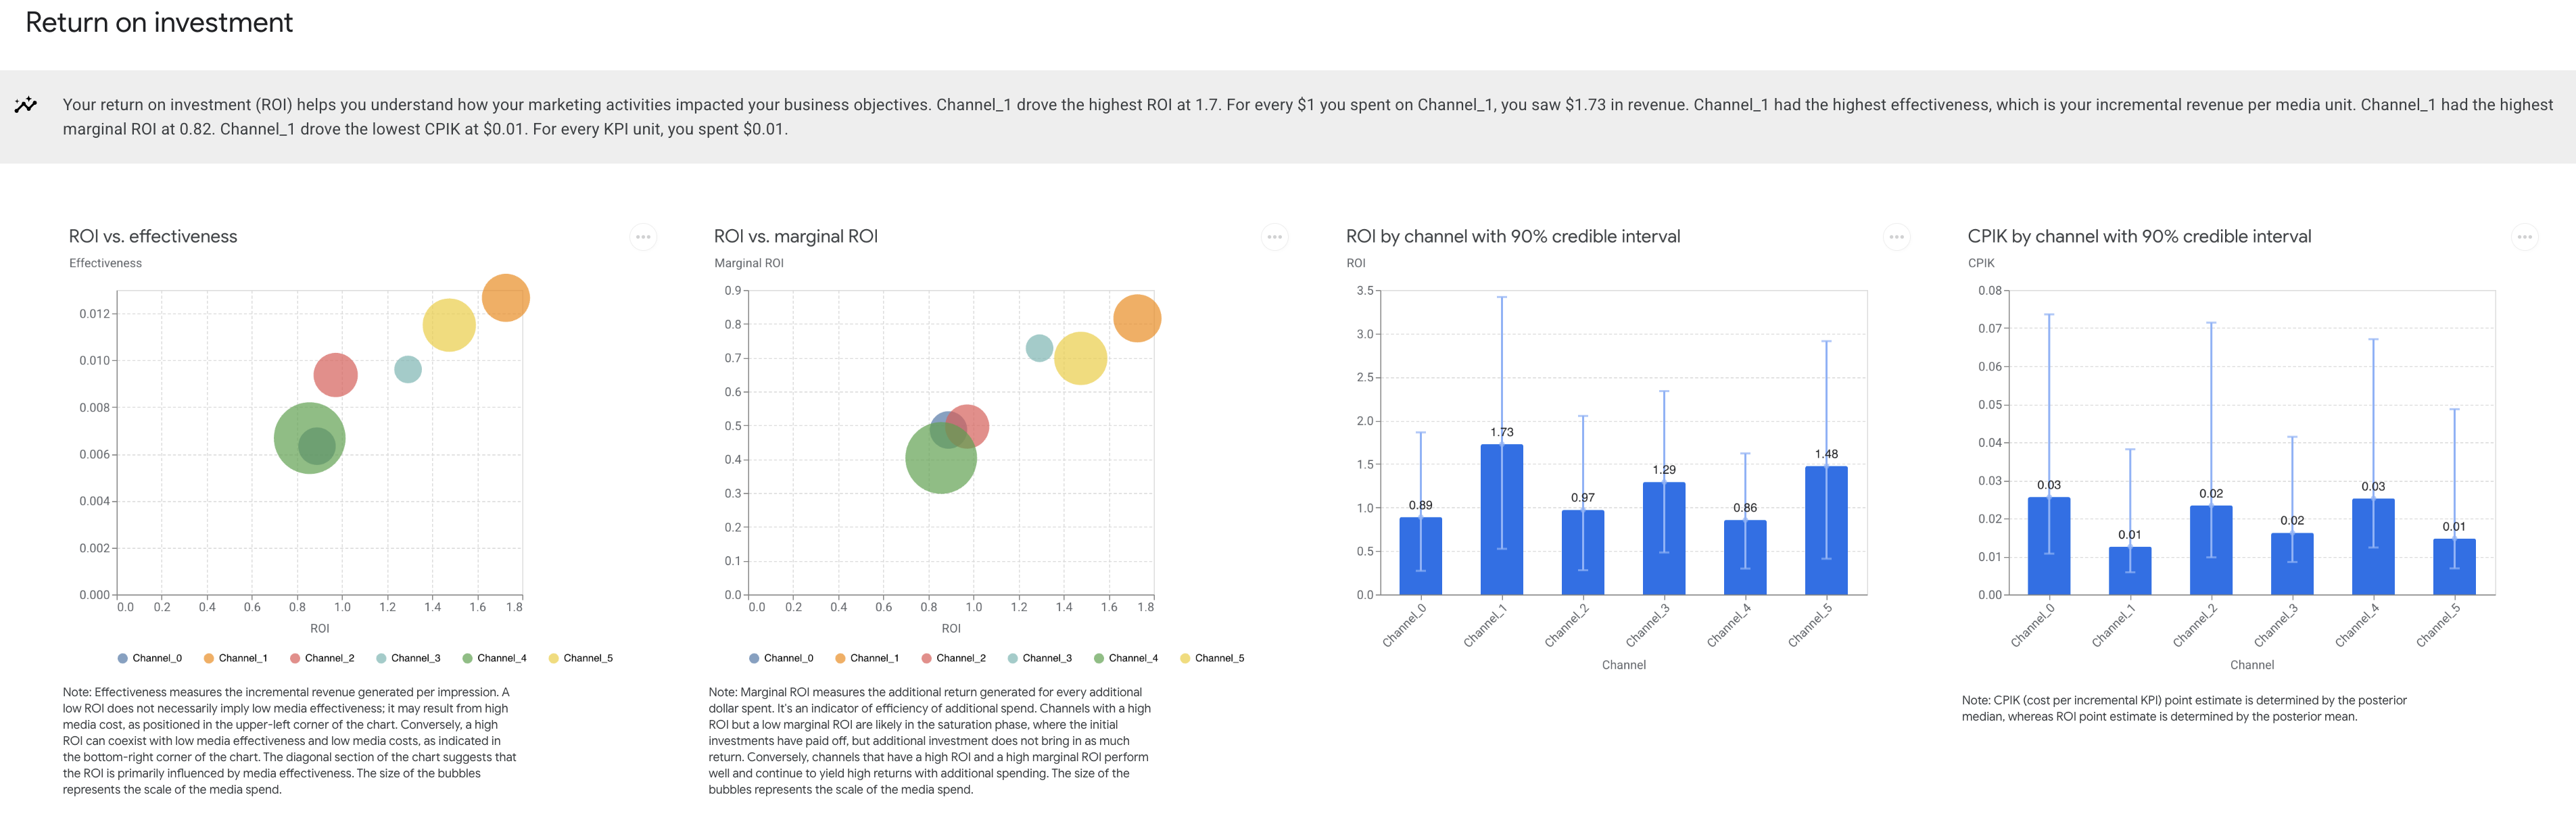
Return on investment
The Return on investment section provides a deeper view of ROI analysis for channels to help you identify the highest performing channels. You can compare ROI, marginal ROI, and effectiveness across channels. Additionally, this section presents the credible interval for the ROI estimations, which constitutes one advantage of Bayesian models.
Example output: (Click the image to enlarge.)
Optimal Analysis
The Optimal Analysis section shows your current spend level and where you start to see diminishing marginal returns on the amount of money you are spending per channel, and provides optimal frequency recommendations to help you decide how to focus your budget for the next year.
Example output:

Generate the model results summary
The model results summaries are generated through the MediaSummary class. When
initiating this class, the credible interval for the model results can be
specified using the confidence_level argument, while the time period for the
model estimation can be specified using the selected_times argument. By
default, the summary statistics are generated using a 90% credible interval and
the full modeling window.
Example:
Run the following commands to generate the summary using the default settings:
media_summary = visualizer.MediaSummary(meridian)
media_summary.summary_table()
Example output: (Click the image to enlarge.)
